Investing Ratios to Know

Valuing a company is no easy task. This post serves to list the most frequently used ratios to help you with this process.

Earnings Per Share: Before you can understand many of these ratios, it is important to learn what earnings per share (EPS) is. EPS is basically the profit that a company has made over the last year divided by how many shares are on the market. It gets a little more complicated because you don’t include preferred shares, also the number of shares could change throughout the year. But don’t worry this number will be given to you on any financial website.

earning per share rato

Price to Earnings Ratio: Price to earnings ratio (P/E) measures what investors are willing to pay for each dollar of earnings for the company. The P/E ratio has its imperfections, but it is nevertheless the most widely reported and used valuation by both investment professionals and public. A high P/E ratio means investors are paying more for today’s earnings in anticipation of future earnings growth.

Essentially, it is the stock’s current price divided by the company’s earnings for the past 12 months. Higher P/Es indicate a riskier market, and vice versa.

Price to earnings Ratio

Debt to Equity Ratio: This is a leverage ratio that compares a company’s total liabilities to its total shareholders’ equity. This is a measurement of how much suppliers, lenders, and creditors  have committed to the company versus what the shareholders have committed. A lower number means that a company is using less leverage and has a stronger equity position. This easy-to-calculate ratio provides a general indication of a company’s equity-liability relationship.

Debt to Equity Ratio

Dividend Yield: is expressed as an annual percentage of the current share price. Dividend yield is calculated as the company’s annual cash dividend per share divided by the current price of the stock. The dividend yield is found in the stock quotes of dividend-paying companies.Dividend YieldPrice to Book Ratio: (P/B) ratio compares a stock’s market price to its book value (shareholders’ equity). The price-to-book value ratio, is an indication of how much shareholders are paying for the net assets of a company. “Price-to-book”, provides investors a way to compare the market value, or what they are paying for each share, to a conservative measure of the value of the firm. This ratio can be calculated by dividing the current closing price of the stock by the latest quarter’s book value per share.Price to Book Ratio

Payout Ratio: This ratio tells you the proportion of earnings paid as dividends to shareholders. The dividend payout ratio is an indicator of how well earnings support the dividend payment. Lower payout ratios are usually preferable, with a ratio over 100% indicating the company pays out more in dividends than in net income.Payout RatioCurrent Ratio: The current ratio is a popular liquidity ratio (also referred to as its current or working capital position). The concept behind this ratio is to measure a company’s ability to pay short-term and long-term obligations. The current ratio considers current total assets of a company relative to their current total liabilities. In theory, the higher the current ratio, the better.

Current Ratio

If this post has helped you in anyway, please comment below and follow the Student Insider Blog for more content yet to come!


Sources: http://www.investopedia.com/slide-show/simple-ratios/ http://money.usnews.com/investing/articles/2017-04-03/5-ratios-investors-need-to-know https://www.google.com/#q=current+ratio

Investment Basics: Bonds

Earlier in the blog, I talked about diversification according to risk. There are various ways that you can stack your profile to offset riskier investments, one of those ways is through investing in bonds. If you are like me, you prefer to have a more holistic background of information when researching a topic.  That is why I love this info-graphic made by Mint, telling you what a bond is, how it works, if it is a safe investment, terms to know, how big the market is etc.

This may not be information that is pivotal to your investing strategy, however, this visual representation was helpful for me when I was strategizing how to invest in bonds. When I was starting out, I didn’t know what the difference between a bond and a CD was. A CD is a timed deposit, where you don’t withdraw any funds until the maturity date. CDs are traditionally opened with banks and other financial institutions. Bonds on the other hand, are a debt security. Bonds loan money to an institution which borrows for a defined period of time at a fixed rate. CDs are a less risky investment than stocks, because they are insured by the Federal Deposit Insurance Corporation (FDIC), if the bank is an FDIC member.

Another point that is there are also bonds available across markets, countries, and currencies. As listed in the infographic, the global bond market is a $91.3 Trillion-dollar industry, compared to a $51.8 Trillion-dollar stock market industry. We are living in a global economy where you have opportunities to invest in countries other than your own. As listed, the United States has the largest market, followed by Europe, Japan, the UK, and China. I was surprised to discover that China only makes up 3.3% of the global bond market.

Bonds are also typically less risky than stocks; however, the type of investment that works best for you all depends on your financial goals and risk you are wanting to take. I really like the type of bonds available section of this infographic. Listed, are treasuries, treasury bonds, treasury inflation-protected securities, bills, notes, and other types of bonds. Additionally, it lists the duration of the bond if available and other facts. This really helps you to learn about the different options available for any type of investor.

Bonds Infographic Media Analysis

Sources: https://www.ally.com/cds/cds-or-bonds-whats-the-difference/

3 Costly Beginner Investing Mistakes You Can Avoid

#1 Imbalanced Asset Allocation

Diversification among different investment classes is good, but it is important to remember to diversify in proportion to risk as well. Portfolio diversification is important to protect against market volatility, but risk diversification is important to remember as well. Investing in stocks vs index funds or bonds is a much riskier investment, so rather than splitting your investment 50/50, a tip from the pros is to diversify in proportion to how much risk you are wanting to take, in addition to diversification across investment classes.

There are multiple resources you can turn to for free evaluations of your own asset diversification, including a free evaluation found on this link. Disclaimer, I am not being paid in any way to recommend any sources on this website, including this evaluation through portfolio checkup creative planning. These are simply the resources that I have used and am recommending for other beginner investors, struggling to know who to trust online. This checkup will scan your accounts for extra or hidden fees, poor performance, and other major red flags. The evaluation is quick and provides an online preliminary analysis of investments for free. The link is found here: Portfolio Checkup


#2 Using a Broker Instead of a Fiduciary

My husband and I currently have an accountant, but have yet to find a financial adviser. One of the challenges is trying to find a great financial adviser who has by best interests at heart; especially considering this is the person I will most likely work with for several years to come. We have been searching the best way we know how—word of mouth, but if anyone has tips on how to find a great fiduciary that would be much appreciated, just comment below! So why am I specifically looking for a fiduciary, instead of a broker or standard wealth/financial adviser?

For multiple reasons, primarily, that according to the President’s Council of Economic Advisers, using a broker instead of a fiduciary costs Americans one percent point of their return annually! This doesn’t sound like very much, but one measly percentage point can actually lower your savings by MORE THAN A QUARTER, over a 35-year period. Tony Robbins gives the example that this would mean (after adjusting for inflation), instead of a $10,000 retirement investment growing to more than $38,000 in 35 years, the $10,000 investment would return only $27,500. The other $10,500 is taken out in fees–that’s more than the original investment!


#3 Investing without Taxes in Mind

“I have enough money to retire and live comfortably for the rest of my life. The problem is, I have to die next week.”- Anonymous

The third costly beginner investment mistake to avoid is investing without tax efficiency. Taxes can wipe out 30% or more of investment returns if you aren’t watchful. One very important investment tip I learned early on is that if you sell any investment you have owned for less than one year, your gains are taxed at the same rates you pay on income taxes! These-sky high income rates can be pretty painful, especially with the risk that investing presents. On the other hand, if you are to hold your investments for more than one year, you pay long-term capital gains tax at the time you sell your investment. This current tax rate is closer to 20%, which is MUCH lower than the income tax rate which for us is 50%! This little tip can save you up to 30% on taxes just by holding investments for longer than one year at a time.

If you are like me, all that matters is how much money you keep, not what you make. The number that matters to me is the net amount I am actually able to keep, reinvest, or give away. Looking for ways to increase your tax efficiency can be a controversial topic, but I would like to point out that there is nothing immoral about strategically arranging finances to lawfully reduce tax burdens. As Federal Appeals Court Judge, Billings Hand stated in 1934:

“Anyone may arrange their affairs so that his taxes shall be as low as possible… nobody owes any public duty to pay more than the law demands.”

Other tax efficient strategies include asset location, tax loss harvesting, managing capital gains, and gifting appreciated securities. If this, or any of the topics above have helped you in your investing journey, please don’t hesitate to comment below! Additionally, if you would like more posts on any of the topics listed above, comment requests!


Sources: https://www.tonyrobbins.com/wealth-lifestyle/5-costly-investing-mistakes/ http://www.investopedia.com/articles/investing/022415/ten-worst-mistakes-beginner-investors-make.asp http://moneysmartlife.com/why-your-investments-care-if-you-use-a-broker-vs-fiduciary/ http://www.dywealth.com/resources/blog/maximizing-returns-investing-taxes-mind


Current Investments-Best Brokers

T

When searching for resources to help me learn how to smartly invest, I would come across many websites with professionals giving investment advice. My problems with what I found online were that investors would provide information without sources, so I am left trusting their judgement. This leads me to question if they have my best interests at heart.

Additionally, these websites would push their paid services every chance they got, without stating their own financial accomplishments. This leads me to automatically discredit a lot of what these individuals write on their blogs and websites, because it is not a trusted source. I wanted to provide this blog as a free platform for beginner investors such as myself to find resources that I have spent a long time finding. All information provided on this blog is taken from top investors with the credibility backing their advice.

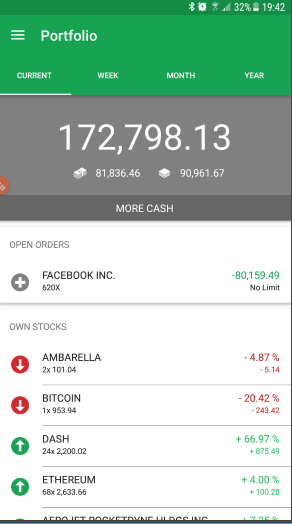
Even still, I wanted to document an investment simulation that my husband and I ran, using the stock market simulator app, Best Brokers. Best Brokers is a free app that allows you to invest in a stock market simulator. The purpose of the app is to help enhance your knowledge of the stock market and test new investing strategies, without the risk of losing any real money. I like this app, because you can interact with other brokers and see watch their investment strategies.

Essentially, everyone in the game begins with $25,000 in simulation money to invest for free. Before we invested our actual money into the stock market, we wanted to practice a little bit and gauge our success. This post is a documentation of those investments and processes using Best Brokers. It should be noted that not all publicly traded investments are available in the app simulation, so investments chose may not have been our first choices.

As of today, our portfolio is worth $210,644.55, beginning with our $25,000 investment. Since the start, we have cultivated a positive 54.89% in change. The account was registered under my husband’s name on May 22, 2016, so essentially over the course of nearly eleven months our series of investments has more than doubled three times! The following images are screenshots of these investment processes, labeled with the date for your convenience. More images are forthcoming!

March 30, 2017March 30th

March 2, 2017

March 4th